Install and Configure ELK Stack 7.3 On CentOS7
INTRODUCTION
Hi Folks, In this tutorial I’m going to install & configure ELK Stack as a Log server inside my testing Lab.
“ELK” is the acronym for the three open source projects call Elasticsearch, Logstash and Kibana. ELK stack made easier to analyze logs to system administrators. ELK stack collect logs from clients using Beats protocol
ELK STACK MAIN COMPONENTS
Elasticsearch is an open source, distributed, RESTful, JSON based search and analytic engine. Easy to use and flexible. Elasticsearch is the heart of ELK stack. Elasticsearch is a No-SQL database.
Logstash is a open source, server-side data processing pipeline that pull events data from multitude of sources simultaneously, transform it, and then sends it to Elasticsearch. Easily pull data from logs, metrics, web applications, data sources and various AWS services. Logstash dynamically transforms and prepares data regardless of format or complexity. Derive structure from unstructured data with grock.
Kibana provides GUI for users visualize data with charts and graphs real-time. It is a window into the Elastic Stack. Provides data exploration, visualization and dashboarding.
Beats is the platform for single-purpose data shippers. They install as lightweight agents and send data from numerous machines to Logstash of


Software Versions I have used in this tutorial.
| Host | IP | Server/Client |
|---|---|---|
| elk.da.com | 192.168.10.10 | Server |
| cl1.da.com | 192.168.10.110 | Client |
| Package | Version |
|---|---|
| Elasticsearch | Version: 7.3 |
| Logstash | Version: 7.3 |
| Kibana | Version: 7.3 |
| Java JDK | jdk-11.0.4 |
STEP 1: COMPLETE PREREQUSITES
A: SET HOSTNAME & FQDN
vim /etc/hostname
elk
vim /etc/hosts
192.168.10.10 elk.da.com elk
B: CLEAR AND REMOVE YUM CACHE (Optional)
sudo rm /etc/yum.repos.d/$REPONAME.repo
yum clean all
Delete the yum cache for the repo
sudo rm -rf /var/cache/yum/x86_64/6/$REPONAME
Clearing the yum Caches
su -c 'yum clean headers'
su -c 'yum clean packages'
su -c 'yum clean metadata'
C: Install and Update Latest RPM Repositories
rpm -ivh https://dl.fedoraproject.org/pub/epel/epel-release-latest-7.noarch.rpm

rpm -ivh https://mirror.webtatic.com/yum/el7/webtatic-release.rpm

rpm -ivh http://rpms.famillecollet.com/enterprise/remi-release-7.rpm

rpm -ivh https://download1.rpmfusion.org/free/el/rpmfusion-free-release-7.noarch.rpm

rpm -ivh http://repository.it4i.cz/mirrors/repoforge/redhat/el7/en/x86_64/rpmforge/RPMS/rpmforge-release-0.5.3-1.el7.rf.x86_64.rpm
D: SeLinux Configuration
vim /etc/selinux/config
SELINUX=permissive
STEP 3: INSTALL JAVA JDK
Java is required for the Elastic stack deployment. Elasticsearch requires Java 8, it is recommended to use the Oracle JDK 1.8. I will install Java 8 from the official Oracle rpm package. ELK requires the Oracle Java JDK package has to be installed. The same JVM version should be installed on all Elasticsearch nodes and clients.
A: Download JAVA JDK 11.0.4
curl -o jdk-11.0.4_linux-x64_bin.rpm https://download.oracle.com/otn/java/jdk/11.0.4+10/cf1bbcbf431a474eb9fc550051f4ee78/jdk-11.0.4_linux-x64_bin.rpm?AuthParam=1566470470_04821224cc5f90794bc98fdb1d1b171a
B: INSTALL JDK RPM 11.0.4
rpm -ivh jdk-11.0.4_linux-x64_bin.rpm
C: SET DEFAULT JAVA VERSION
alternatives --config java

alternatives --set jar /usr/java/jdk-11.0.4/bin/jar

alternatives --set javac /usr/java/jdk-11.0.4/bin/javac
D: SET JAVA ENVIRONMENT VARIABLES
SET JAVAC AND JAR PATHS
export JAVA_HOME=/usr/java/jdk-11.0.4/
export PATH=$PATH:/usr/java/jdk-11.0.4/bin/
vim ~/.bashrc
export JAVA_HOME=/usr/java/jdk-11.0.4/
export PATH=$PATH:/usr/java/jdk-11.0.4/bin/
vim ~/.bash_profile
export JAVA_HOME=/usr/java/jdk-11.0.4/
export PATH=$PATH:/usr/java/jdk-11.0.4/bin/
E: CHECK JAVA VERSION
java -version
java version "11.0.4" 2019-07-16 LTS
Java(TM) SE Runtime Environment 18.9 (build 11.0.4+10-LTS)
Java HotSpot(TM) 64-Bit Server VM 18.9 (build 11.0.4+10-LTS, mixed mode)
STEP 3: INSTALL AND CONFIGURE ELASTICSEARCH
In this step, I will install and configure Elasticsearch version 7.3
A: IMPORT PUBLIC GPG KEY TO THE ELK-STACK SERVER
rpm --import https://artifacts.elastic.co/GPG-KEY-elasticsearch
B: CREATE YUM REPO FILE FOR ELASTICSEARCH
vim /etc/yum.repos.d/elasticsearch.repo
[elasticsearch-7.x]
name=Elasticsearch repository for 7.x packages
baseurl=https://artifacts.elastic.co/packages/7.x/yum
gpgcheck=1
gpgkey=https://artifacts.elastic.co/GPG-KEY-elasticsearch
enabled=1
autorefresh=1
type=rpm-md
C: INSTALL ELASTICSEARCH YUM PACKAGES
sudo yum -y install elasticsearch
CONFIGURE ELASTICSEARCH
Do the following changes
vim /etc/elasticsearch/elasticsearch.yml
cluster.name: elk
node.name: node-1
path.data: /var/lib/elasticsearch
path.logs: /var/log/elasticsearch
network.host: 127.0.0.1
http.host: 0.0.0.0
http.port: 9200
JVM Options Configuration
Set initial/maximum size of total heap space. If your system has less memory. You should configure it to use small megabytes of ram.
vim /etc/elasticsearch/jvm.options
-Xms4g
-Xmx4g
FIREWALL CONFIGURATION
Allow traffic through the TCP port 9200 in the firewall.
firewall-cmd --permanent --add-port=9200/tcp

firewall-cmd --permanent --add-port=9300/tcp

firewall-cmd --reload
START & ENABLE ELASTICSEARCH AT SYSTEM BOOT
sudo yum install elasticsearch

sudo /bin/systemctl daemon-reload

sudo /bin/systemctl enable elasticsearch.service

sudo /bin/systemctl restart elasticsearch.service

sudo /bin/systemctl status -l elasticsearch.service

sudo journalctl -f

sudo journalctl --unit elasticsearch
TEST ELASTICSEARCH
Check Elasticsearch port “9200” state as “LISTEN”
netstat -plntu
OPEN IN BROWSER
http://192.168.10.10:9200/?pretty
OPEN IN TERMINAL
curl -XGET '192.168.10.10:9200/?pretty'
STEP 4: INSTALL AND CONFIGURE LOGSTASH
In this step I will install Logstash version 7.3 and configure it as a central log server, receives logs from clients with Filebeat/Auditbeat, then filter and transform the syslog/Audit data and move it into the stash (Elasticsearch)
A: IMPORT PUBLIC GPG KEY TO THE ELK-STACK SERVER
rpm --import https://artifacts.elastic.co/GPG-KEY-elasticsearch
B: CREATE YUM REPO FILE FOR ELASTICSEARCH
vim /etc/yum.repos.d/logstash.repo
[logstash-7.x]
name=Elastic repository for 7.x packages
baseurl=https://artifacts.elastic.co/packages/7.x/yum
gpgcheck=1
gpgkey=https://artifacts.elastic.co/GPG-KEY-elasticsearch
enabled=1
autorefresh=1
type=rpm-md
C: INSTALL LOGSTASH YUM PACKAGES
sudo yum -y install logstash
NOTE: Need to genarate SSL Certificate if you using SSL.This step is optional
GENERATE A NEW SSL CERTIFICATE Create new ssl certificate for securing communication between Logstash & Filebeat (clients). SSL Certificate file use clients to identify the elastic server.
Do the following changes under the “[ V3_ca ]” section for the server identification.
vim /etc/pki/tls/openssl.cnf[ v3_ca ] #Server IP Address subjectAltName = IP: 192.168.10.10Generate the certificate file with the openssl command.
openssl req -config /etc/pki/tls/openssl.cnf -x509 -days 3650 -batch -nodes -newkey rsa:2048 -keyout /etc/pki/tls/private/logstash-forwarder.key -out /etc/pki/tls/certs/logstash-forwarder.crtOnce ssl certificate is ready, this certificate should be copied to all the clients using scp command.
D: CONFIGURE LOGSTASH
vim /etc/logstash/logstash.yml
path.data: /var/lib/logstash
http.host: "192.168.10.10"
path.logs: /var/log/logstash
sudo /bin/systemctl daemon-reload

sudo /bin/systemctl enable logstash.service

sudo /bin/systemctl restart logstash.service

sudo /bin/systemctl status -l logstash.service

sudo journalctl -f

sudo journalctl --unit elasticsearch
E: JVM configuration
vim /etc/logstash/jvm.options
-Xms4g
-Xmx4g
F: Create Following Files Under /etc/logstash/conf.d/ Directory.
vim /etc/logstash/conf.d/auditbeat.conf
### INPUT SECTION ###
### This section make Logstash to listen on port 5044 for incoming logs & provides SSL certificate for secure connection.
input {
  beats {
    port => 5044
#   ssl => true
#   ssl_certificate => "/etc/pki/tls/certs/logstash-forwarder.crt"
#   ssl_key => "/etc/pki/tls/private/logstash-forwarder.key"
  }
}

### OUTPUT SECTION ###
### This section defines the storage for the logs to be stored.
output {
  elasticsearch {
    hosts => ["http://192.168.10.10:9200"]
    manage_template => false
    index => "%{[@metadata][beat]}-%{[@metadata][version]}-%{+YYYY.MM.DD}"
    document_type => "%{[@metadata][type]}"
  }
}
G: FIREWALL CONFIGURATION
Allow traffic through the TCP port 5044 in the firewall.
firewall-cmd --permanent --add-port=5044/tcp
firewall-cmd --reload
ENABLE & START LOGSTASH SERVICE
sudo /bin/systemctl daemon-reload
sudo /bin/systemctl enable logstash.service
sudo /bin/systemctl restart logstash.service
sudo /bin/systemctl status -l logstash.service
sudo journalctl -f
sudo journalctl --unit elasticsearch
STEP 5: INSTALL AND CONFIGURE KIBANA
A: IMPORT PUBLIC GPG KEY TO THE ELK-STACK SERVER
rpm --import https://artifacts.elastic.co/GPG-KEY-elasticsearch
B: CREATE YUM REPO FILE FOR KIBANA
vim /etc/yum.repos.d/kibana.repo
[kibana-7.x]
name=Kibana repository for 7.x packages
baseurl=https://artifacts.elastic.co/packages/7.x/yum
gpgcheck=1
gpgkey=https://artifacts.elastic.co/GPG-KEY-elasticsearch
enabled=1
autorefresh=1
type=rpm-md
C: INSTALL KIBANA YUM PACKAGES
sudo yum install kibana
D: CONFIGURE KIBANA
vim /etc/kibana/kibana.yml
server.port: 5601
server.host: "0.0.0.0"
server.name: "elk"
elasticsearch.hosts: ["http://127.0.0.1:9200"]
E: FIREWALL CONFIGURATION
Allow traffic through the TCP port 5044 in the firewall.
firewall-cmd --permanent --add-port=5601/tcp
firewall-cmd --reload
F: ENABLE & START LOGSTASH SERVICE
sudo /bin/systemctl daemon-reload

sudo /bin/systemctl enable kibana.service

sudo /bin/systemctl restart kibana.service

sudo /bin/systemctl status -l  kibana.service
netstat -tulpena | grep 5601
STEP 6: INSTALL AND CONFIGURE NGINX
A: INSATLL EPEL REPOSITORY
yum install epel-release
B: INSTALL NGINX & HTTPD-TOOLS
yum install nginx httpd-tools
CREATE USERNAME “ADMIN” AND PASSWORD “PASSWORD” FOR KIBANA WEB INTERFACE
htpasswd -c /etc/nginx/htpasswd.kibana admin
C: CONFIGURE NGINX
Edit the Nginx configuration file and remove the ‘server { }’ block, so we can add a new virtual host configuration.
vim /etc/nginx/nginx.conf
COMMENT {Server} Block:
Create new virtual host configuration file named “kibana.conf” under the conf.d directory.
D: Create VHOST FOr KIBANA:
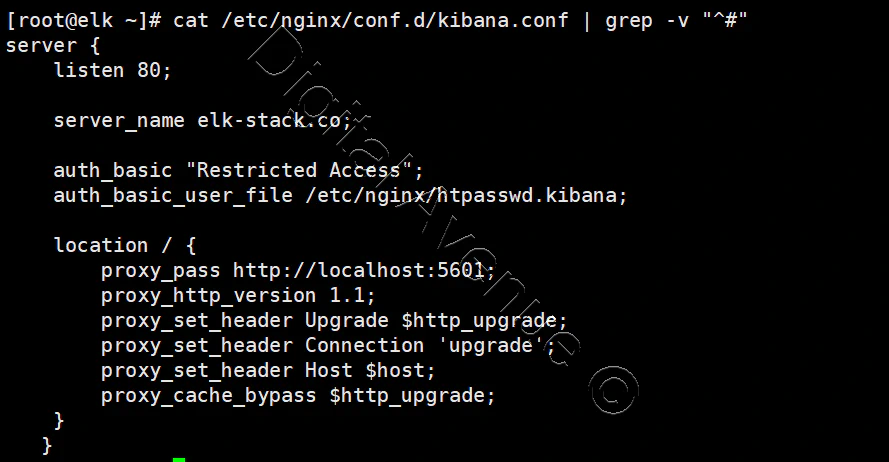
vim /etc/nginx/conf.d/kibana.conf
server {
    listen 80;

    server_name elk-stack.co;

    auth_basic "Restricted Access";
    auth_basic_user_file /etc/nginx/htpasswd.kibana;

    location / {
        proxy_pass http://localhost:5601;
        proxy_http_version 1.1;
        proxy_set_header Upgrade $http_upgrade;
        proxy_set_header Connection 'upgrade';
        proxy_set_header Host $host;
        proxy_cache_bypass $http_upgrade;
    }
   }

E: Check Nginx Configuration
nginx -t
F: FIREWALL CONFIGURATION
Allow traffic through the TCP port 80 in the firewall.
firewall-cmd --permanent --add-port=80/tcp
firewall-cmd --permanent --add-service=http
firewall-cmd --reload
G: ENABLE & START NGINX SERVICE
systemctl enable nginx.service
systemctl restart nginx.service
SELINUX CONFGURATION
setsebool -P httpd_can_network_connect 1
STEP 07: Connect Kibana Frontend With Elasticsearch
You need assign Kibana to which Elasticsearch indeces you want yo explore.
Configure the Elasticsearch Indices what you want to access with Kibana.
Open Web Browser and Point To…
(Only via Kibana)
http://YOURIP.com:5601
OR
(If nginx/apache proxy redirect with VHOST)
http://YOURIP.com:80
Deploy Production Grade Kubernetes Cluster on Azure AKS
Introduction This tutorial is intended to demonstrate how to setup your 1st Kubernetes cluster on Azure Kubernetes Services (AKS). This tutorial will cover up all the steps that you need to setup complete AKS cluster.
Getting Started With Docker - Quick Start Guide
Getting Started With Docker - Quick Start Guide Docker Engine Platform as a Service (PaaS) Cloud platform service. Allows you to manage its application and data.
How To Run Microsoft SQL Server On Kubernetes - Azure Kubernetes Service
Prerequisites: Azure CLI https://docs.microsoft.com/en-us/cli/azure/install-azure-cli 1. Run the Azure CLI with the az command. 1.1 Run the login command. az login Login in the browser with the azure account.


