Install and Configure ELK Stack On CentOS7
“ELK” is the acronym for the three open source projects call Elasticsearch, Logstash and Kibana. ELK stack made easier to analyze logs to system administrators. ELK stack collect logs from clients using Beats protocol.
ELK Stack Main Components:-
Elasticsearch is an open source, distributed, RESTful, JSON based search and analytic engine. Easy to use and flexible. Elasticsearch is the heart of ELK stack. Elasticsearch is a No-SQL database.
Logstash is a open source, server-side data processing pipeline that pull events data from multitude of sources simultaneously, transform it, and then sends it to Elasticsearch. Easily pull data from logs, metrics, web applications, data sources and various AWS services. Logstash dynamically transforms and prepares data regardless of format or complexity. Derive structure from unstructured data with grock.
Kibana provides GUI for users visualize data with charts and graphs real-time. It is a window into the Elastic Stack. Provides data exploration, visualization and dashboarding.
Beats is the platform for single-purpose data shippers. They install as lightweight agents and send data from numerous machines to Logstash of Elasticsearch.
FileBeat will send logs to Logstash, Logstash process incoming logs and stores into Elasticsearch, and then we can visualize through the Kibana web interface.
ELK Stack Architecture


Software Versions I have used in this tutorial.
ELK Stack Server 192.168.100.10 (CentOS7) Beat Client 192.168.100.50 (CentOS7) Elasticsearch Version: 6.3.1 Logstash Version 6.3.1 Kibana Version 6.3.1
STEP 1 - Install Java 8
Java is required for the Elastic stack deployment. Elasticsearch requires Java 8, it is recommended to use the Oracle JDK 1.8. I will install Java 8 from the official Oracle rpm package. ELK requires the Oracle Java JDK package has to be installed. The same JVM version should be installed on all Elasticsearch nodes and clients.
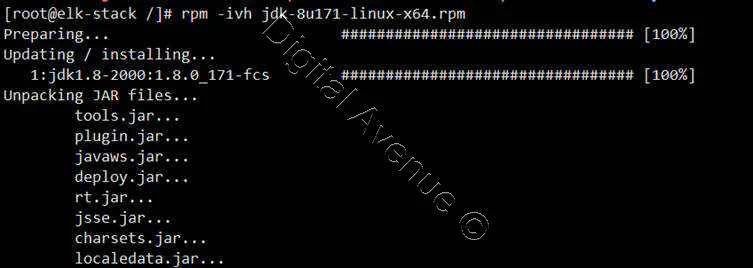
Install JDK RPM
[root@elk-stack /]# rpm -ivh jdk-8u171-linux-x64.rpm
Set Default JAVA Version
[root@elk-stack /]# alternatives --config java

Set JAVAC and JAR Paths
[root@elk-stack /]# alternatives --set jar /usr/java/jdk1.8.0_171-amd64/bin/jar
[root@elk-stack /]# alternatives --set javac /usr/java/jdk1.8.0_171-amd64/bin/javac
Check JAVA Version
[root@elk-stack /]# java -version

Set JAVA Environment Variables
[root@elk-stack /]# export JAVA_HOME=/usr/java/jdk1.8.0_171-amd64/
[root@elk-stack /]# export JRE_HOME=/usr/java/jdk1.8.0_171-amd64/jre/
[root@elk-stack /]# export PATH=$PATH:/usr/java/jdk1.8.0_171-amd64/bin/:/usr/java/jdk1.8.0_171-amd64/jre/bin/
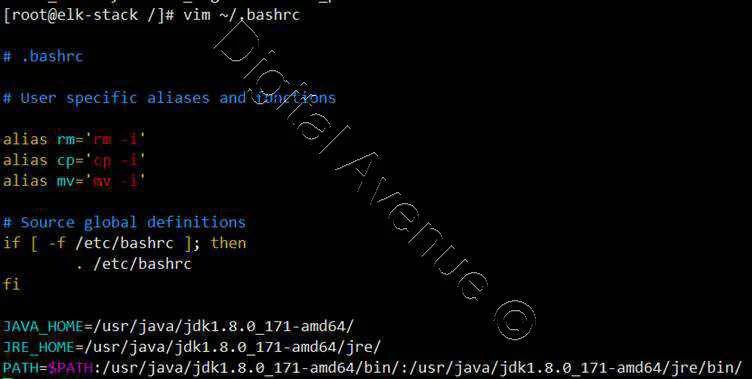
Set Environment Variables on /etc/bashrc to Auto Set at System Boot
[root@elk-stack /]# vim ~/.bashrc
JAVA_HOME=/usr/java/jdk1.8.0_171-amd64/
JRE_HOME=/usr/java/jdk1.8.0_171-amd64/jre/
PATH=$PATH:/usr/java/jdk1.8.0_171-amd64/bin/:/usr/java/jdk1.8.0_171-amd64/jre/bin/
STEP 2 – INSTALL AND CONFIGURE ELASTICSEARCH
In this step, I will install and configure Elasticsearch version 6.3.1
A. Import Public GPG Key to the ELK-Stack Server
[root@elk-stack /]# rpm --import https://artifacts.elastic.co/GPG-KEY-elasticsearch
B. Download Elasticsearch RPM Package
[root@elk-stack /]# wget https://artifacts.elastic.co/downloads/elasticsearch/elasticsearch-6.3.1.rpm
C. Install Elasticsearch RPM Package
[root@elk-stack /]# rpm -ivh elasticsearch-6.3.1.rpm

D. Firewall Configuration
Allow traffic through the TCP port 9200 in the firewall.
[root@elk-stack /]# firewall-cmd --permanent --add-port=9200/tcp
[root@elk-stack ~]# firewall-cmd --permanent --add-port=9300/tcp
[root@elk-stack /]# firewall-cmd –reload
E. Configure Elasticsearch
Do the following changes
[root@elk-stack /]# vim /etc/elasticsearch/elasticsearch.yml
cluster.name: my-application
node.name: node-1
path.data: /var/lib/elasticsearch
path.logs: /var/log/elasticsearch
network.host: 127.0.0.1
#network.host: 192.168.100.10
http.port: 9200
F. Start & Enable Elasticsearch at System Boot
[root@elk-stack /]# systemctl start elasticsearch.service
[root@elk-stack /]# systemctl enable elasticsearch.service
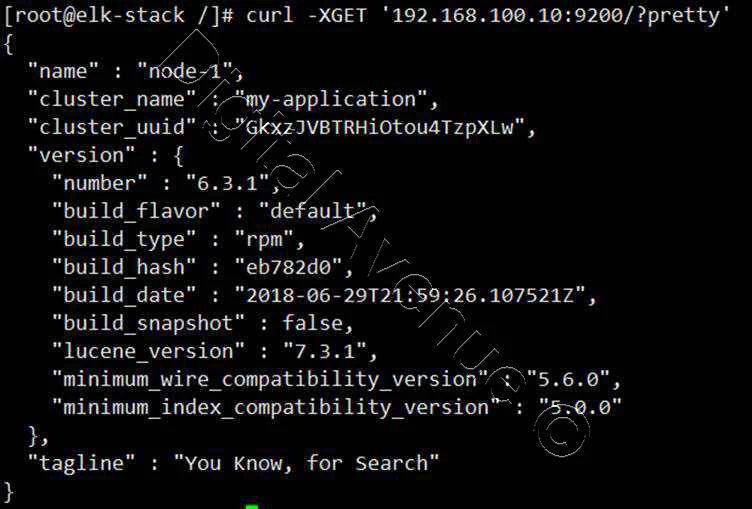
G. Test Elasticsearch
Check Elasticsearch port “9200” state as “LISTEN”
[root@elk-stack /]# netstat -plntu

[root@elk-stack /]# curl -XGET '192.168.100.10:9200/?pretty'
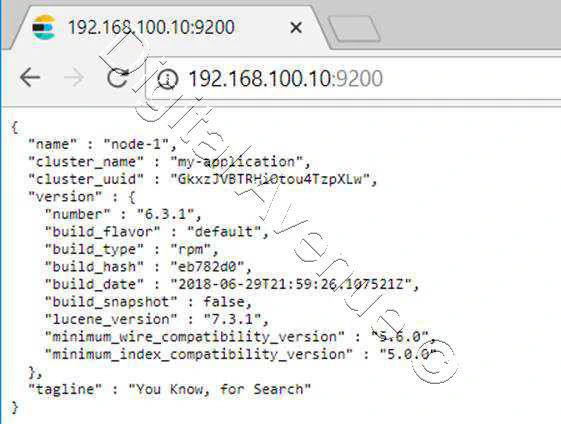
Output from the external web browser
STEP 3 – INSTALL AND CONFIGURE LOGSTASH
In this step I will install Logstash version 6.3.1 and configure it as a central log server, receives logs from clients with Filebeat, then filter and transform the syslog data and move it into the stash (Elasticsearch)
A. Import Public GPG Key to the ELK-Stack Server
[root@elk-stack /]# rpm --import https://artifacts.elastic.co/GPG-KEY-elasticsearch
B. Download Logstash RPM Package
[root@elk-stack /]# wget https://artifacts.elastic.co/downloads/logstash/logstash-6.3.1.rpm
C. Install Logstash RPM Package
[root@elk-stack /]# rpm -ivh logstash-6.3.1.rpm

D. Firewall Configuration
Allow traffic through the TCP port 5044 in the firewall.
[root@elk-stack /]# firewall-cmd --permanent --add-port=5044/tcp
[root@elk-stack /]# firewall-cmd --reload
E. Generate a New SSL Certificate
Create new ssl certificate for securing communication between Logstash & Filebeat (clients). SSL Certificate file use clients to identify the elastic server.
Do the following changes under the “[ V3_ca ]” section for the server identification.
[ v3_ca ]
#Server IP Address
subjectAltName = IP: 192.168.100.10
Generate the certificate file with the openssl command.
[root@elk-stack /]# openssl req -config /etc/pki/tls/openssl.cnf -x509 -days 3650 -batch -nodes -newkey rsa:2048 -keyout /etc/pki/tls/private/logstash-forwarder.key -out /etc/pki/tls/certs/logstash-forwarder.crt

Once ssl certificate is ready, this certificate should be copied to all the clients using scp command.
F. Configure Logstash
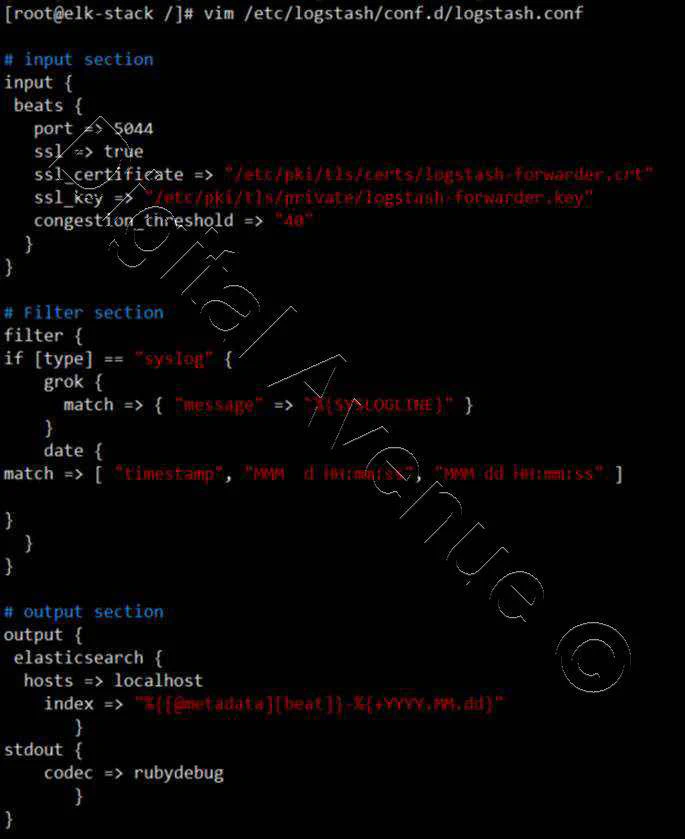
Create new configuration file named “logstash.conf” under the “/etc/logstash/conf.d” directory.
[root@elk-stack /]# vim /etc/logstash/conf.d/logstash.conf
There are three sections in “logstash.conf” file.
1. Input Section
This section make Logstash to listen on port 5044 for incoming logs & provides SSL certificate for secure connection.
# input section
input {
 beats {
   port => 5044
   ssl => true
   ssl_certificate => "/etc/pki/tls/certs/logstash-forwarder.crt"
   ssl_key => "/etc/pki/tls/private/logstash-forwarder.key"
   congestion_threshold => "40"
  }
}
2. Filter Section
This section parse the logs before sending them to Elasticsearch.
# Filter section
filter {
if [type] == "syslog" {
    grok {
      match => { "message" => "%{SYSLOGLINE}" }
    }
    date {
match => [ "timestamp", "MMM  d HH:mm:ss", "MMM dd HH:mm:ss" ]

}
  }
}
3. Output Section
This section defines the storage for the logs to be stored.
# output section
output {
 elasticsearch {
  hosts => localhost
    index => "%{[@metadata][beat]}-%{+YYYY.MM.dd}"
       }
stdout {
    codec => rubydebug
       }
}
G. Enable & Start Logstash Service
[root@elk-stack /]# systemctl daemon-reload
[root@elk-stack /]# systemctl enable logstash.service
[root@elk-stack /]# systemctl start logstash.service
STEP 4 – INSTALL AND CONFIGURE KIBANA
A. Import Public GPG Key to the ELK-Stack Server
[root@elk-stack /]# rpm --import https://artifacts.elastic.co/GPG-KEY-elasticsearch
B. Download Logstash RPM Package
[root@elk-stack /]# rpm -ivh kibana-6.3.1-x86_64.rpm

C. Firewall Configuration
Allow traffic through the TCP port 5601 in the firewall.
[root@elk-stack /]# firewall-cmd --permanent --add-port=5601/tcp
[root@elk-stack /]# firewall-cmd –reload
D. Configure Kibana
[root@elk-stack /]# vim /etc/kibana/kibana.yml
server.port: 5601
server.host: "127.0.0.1"
server.name: "Kibana Monitor"
elasticsearch.url: “http://localhost:9200”
E. Enable & Start Logstash Service
[root@elk-stack /]# systemctl daemon-reload
[root@elk-stack /]# systemctl enable kibana.service
[root@elk-stack /]# systemctl start kibana.service
STEP 5 – INSTALL AND CONFIGURE Nginx
A. Insatll EPEL Repository
[root@elk-stack /]# yum -y install epel-release
B. Install Nginx & httpd-tools
[root@elk-stack /]# yum -y install nginx httpd-tools
C. Create Username “admin” and Password “123456” for Kibana Web Interface
[root@elk-stack /]# htpasswd -c /etc/nginx/htpasswd.users admin

D. Configure Nginx
Edit the Nginx configuration file and remove the ‘server { }’ block, so we can add a new virtual host configuration.
[root@elk-stack /]# vim /etc/nginx/nginx.conf
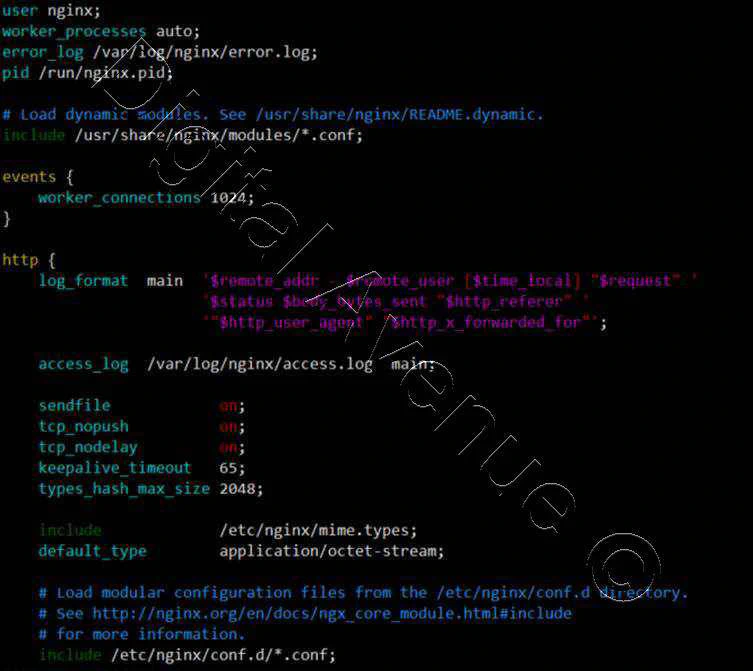
Create new virtual host configuration file named “kibana.conf” under the conf.d directory.
[root@elk-stack /]# vim /etc/nginx/conf.d/kibana.conf
server {
    listen 80;

    server_name elk-stack.co;

    auth_basic "Restricted Access";
    auth_basic_user_file /etc/nginx/.kibana-user;

    location / {
        proxy_pass http://localhost:5601;
        proxy_http_version 1.1;
        proxy_set_header Upgrade $http_upgrade;
        proxy_set_header Connection 'upgrade';
        proxy_set_header Host $host;
        proxy_cache_bypass $http_upgrade;
    }
   }
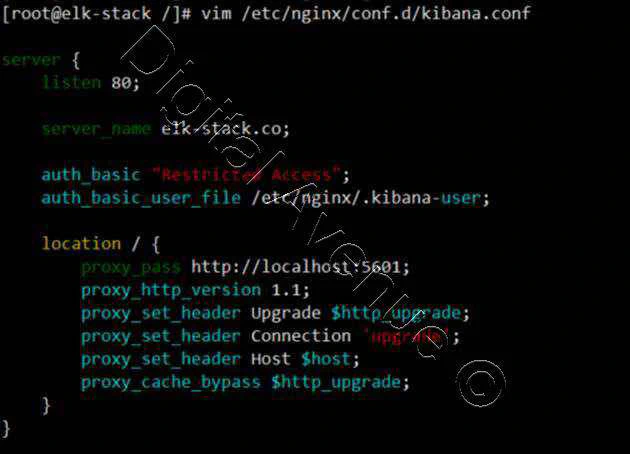
Check Nginx Configuration

E. Enable & Start Nginx Service
[root@elk-stack /]# systemctl enable nginx.service
[root@elk-stack /]# systemctl start nginx.service
F. Firewall Configuration
Allow traffic through the TCP port 80 in the firewall.
[root@elk-stack ~]# firewall-cmd --permanent --add-port=80/tcp
[root@elk-stack ~]# firewall-cmd --permanent --add-service=http
[root@elk-stack ~]# firewall-cmd --reload
G. SELinux Confguration
[root@elk-stack kibana]# setsebool -P httpd_can_network_connect 1
STEP 6 – Install & Configure Filebeat on the Client
A. Copy SSL Certificate from ELK Server to Client
[root@elk-stack ~]# scp /etc/pki/tls/certs/logstash-forwarder.crt root@192.168.100.50:/etc/pki/tls/certs/
B. Import Public GPG Key to the ELK-Stack Server
[root@elk-stack /]# rpm --import https://artifacts.elastic.co/GPG-KEY-elasticsearch
C. Download & Install Filebeat RPM Package
[root@cl1 /]# wget https://artifacts.elastic.co/downloads/beats/filebeat/filebeat-6.3.1-x86_64.rpm

[root@cl1 /]# rpm -ivh filebeat-6.3.1-x86_64.rpm

Configure File Beat
[root@cl1 /]#vim /etc/filebeat/filebeat.yml
In the paths: section paths:
- /var/log/secure
- /var/log/messages
OR
/var/log/*.log
By default, Filebeat is using Elasticsearch as the output target by default. Disable Elasticsearch output by commenting the configuration.
142 #-------------------------- Elasticsearch output ------------------------------
143 #output.elasticsearch:
144 # Array of hosts to connect to.
145 # hosts: ["localhost:9200"]
Now add the Logstash as the new output configuration and do the changes as show below.
152 #----------------------------- Logstash output --------------------------------
153 output.logstash:
154   # The Logstash hosts
155   hosts: ["localhost:5044"]
156   bulk_max_size: 1024
157   ssl.certificate_authorities: ["/etc/pki/tls/certs/logstash-forwarder.crt"]
158   template.name: "filebeat"
159   template.path: "filebeat.template.json"
160   template.overwrite: false
After that configurations will look like below.
filebeat.inputs:

- type: log
  enabled: false
  paths:
    - /var/log/*.log

output.logstash:
  hosts: ["localhost:5044"]
  bulk_max_size: 1024
  ssl.certificate_authorities: ["/etc/pki/tls/certs/logstash-forwarder.crt"]
  template.name: "filebeat"
  template.path: "filebeat.template.json"
  template.overwrite: false
E. Enable & Start Filebeat Service
[root@cl1 /]# systemctl enable filebeat.service
[root@cl1 /]# systemctl start filebeat.service
STEP 7 – Using Elastic Stack
Login to Kibana dashboard using the browser with password that you used at Nginx configuration.
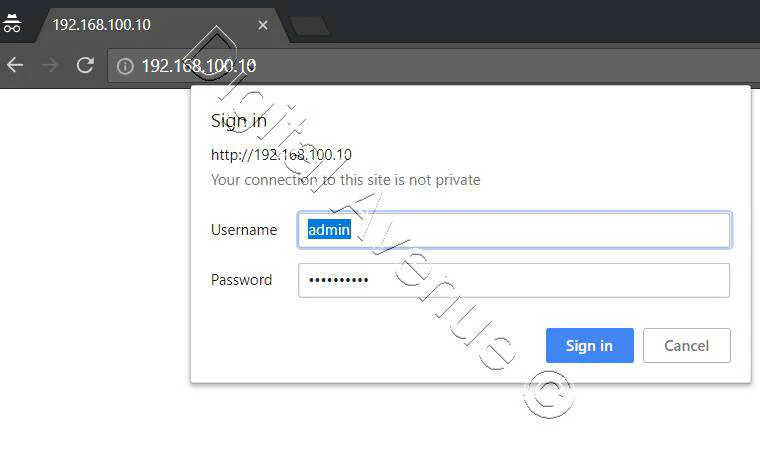
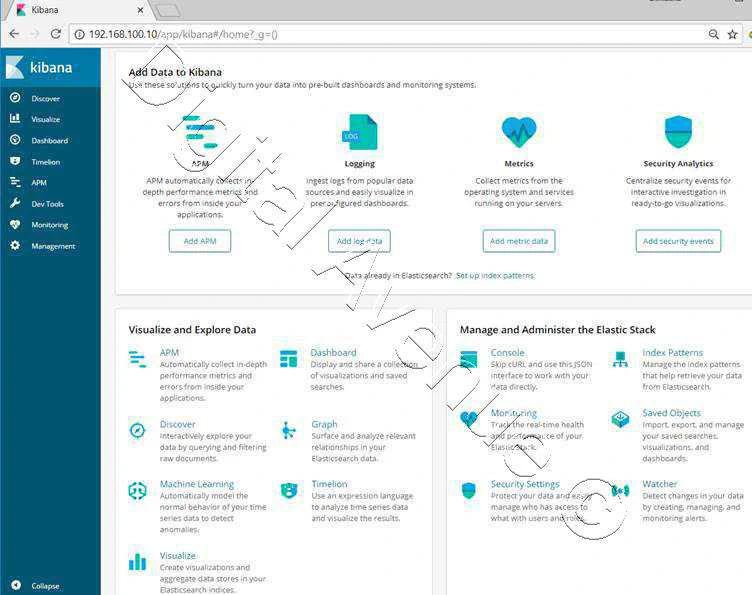
Now ELK Initial Steps are completed. We’ll discuss regarding Log Monitoring in a next tutorial.
Little Request:
I appreciate you guys taking the time in reading my post. Please check out my YouTube channel and please subscribe for more as it’ll help me loads.
Deploy Production Grade Kubernetes Cluster on Azure AKS
Introduction This tutorial is intended to demonstrate how to setup your 1st Kubernetes cluster on Azure Kubernetes Services (AKS). This tutorial will cover up all the steps that you need to setup complete AKS cluster.
Getting Started With Docker - Quick Start Guide
Getting Started With Docker - Quick Start Guide Docker Engine Platform as a Service (PaaS) Cloud platform service. Allows you to manage its application and data.
How To Run Microsoft SQL Server On Kubernetes - Azure Kubernetes Service
Prerequisites: Azure CLI https://docs.microsoft.com/en-us/cli/azure/install-azure-cli 1. Run the Azure CLI with the az command. 1.1 Run the login command. az login Login in the browser with the azure account.
